Shared Analytical Facilities
Electron Probe Micro-analysis Lab, Peking University SESS
The Geochemical Analysis Of Trace Elements In Our laboratory
The Ultra Clean Isotope Geochemistry Laboratory
Scanning Electron Microscopy of SESS. PKU
Electron Probe Micro-analysis Lab, Peking University SESS --------
a state-of-the-art facility for chemical microanalysis in geosciences
Address: Peking University, Yifu Building No.2 Room 3116
Contact: +86 (010) 6275 1168 / [email protected]
ABOUT EPMA
The Electron Probe Micro Analyzer (hereinafter, “EPMA”) is an instrument to analyze which elements compose a substance, by irradiating electron beams onto the substance surface and measuring the characteristic X-ray that is generated.
EPMA was devised and presented by Dr. Castaing of France in his academic dissertation in 1951. EPMA today is playing an active role worldwide, as an all-purpose, multi-functional tool equipped with electron optics technology, X-ray spectrometry technology, system control and data processing technology. EPMA has evolved into an instrument that can handle elemental analysis of sub-micron areas as well as observation, analysis, and image analysis for areas as large as 10cm square.
All-purpose surface analysis instrument from electron image observation to elemental analysis and structure analysis of small areas
The Electron Probe Micro Analyzer (hereinafter, “EPMA”) is an instrument to analyze which elements compose a substance, by irradiating electron beams onto the substance surface and measuring the characteristic X-ray that is generated.
EPMA was devised and presented by Dr. Castaing of France in his academic dissertation in 1951. EPMA today is playing an active role worldwide, as an all-purpose, multi-functional tool equipped with electron optics technology, X-ray spectrometry technology, system control and data processing technology. EPMA has evolved into an instrument that can handle elemental analysis of sub-micron areas as well as observation, analysis, and image analysis for areas as large as 10cm square.This instrument is used for basic research in a diverse range of fields, such as steel, minerals, semiconductors, ceramics, textiles, medical and dental materials, medicine, and biology, as well as for application research and product quality management.
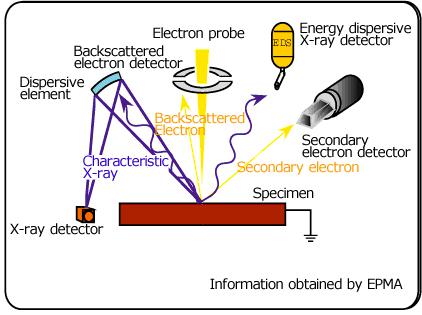
What is the structure of EPMA?
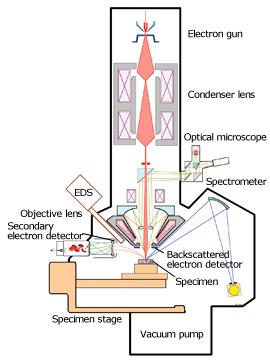
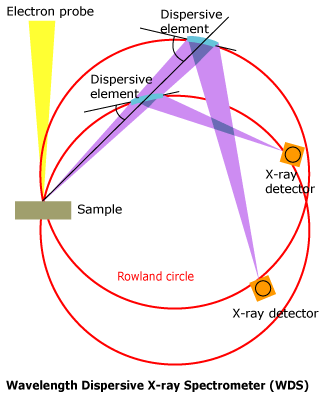
The figure at the right shows the structure of an EPMA device.
Electrons emitted from the electron source are accelerated at a certain accelerating voltage and collimated through electron lenses. When this electron beam hits a specimen, X-rays are generated from the specimen. By dispersing this X-ray using a dispersive element, the composition of the specimen can be examined. This type of spectrometer is called a wavelength dispersive X-ray spectrometer (WDS).
What signals should be measured?
When accelerated electrons hit a specimen, in addition to the X-rays, particles and electromagnetic waves carrying various kinds of information are emitted. With EPMA, signals such as the characteristic-X-rays, secondary electrons, backscattered electrons, etc. are detected by the appropriate detectors and that information is utilized to find the area of interest on a specimen, and for analysis.
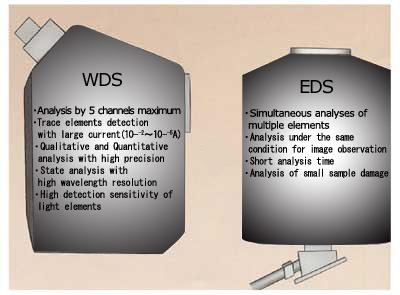
What is the difference between WDS and EDS spectrometry?
In addition to WDS, another spectrometry method for analyzing the characteristic X-rays is energy dispersive X-ray spectrometry (EDS). There are differences between WDS and EDS due to the differences in the spectrometry method, as shown in the figure at the left
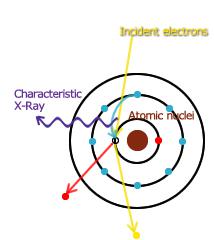
What is the mechanism of characteristic X-ray generation?
The model at the right shows how characteristic X-rays are generated.
Accelerated electrons kick out an electron around an atomic nucleus. An electron from an outer shell at a higher energy level comes down to take the place of the ejected electron. This movement between energy levels is accompanied by the emission of an X-ray with a wavelength that is equivalent to the energy difference.
Since the energy level of an element is unique to the element, by investigating the wavelength of the X-ray emitted, or the energy, it is possible to identify which elements compose the substance being examined.
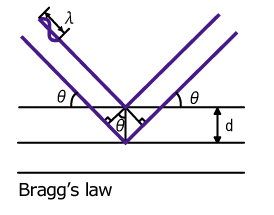
What is Bragg diffraction?
When X-ray is reflected (diffracted) by a dispersive element, only the X-ray which has a wavelength satisfying “Bragg’s law nλ=2dsinθ” is reflected. Wavelength dispersive X-ray Spectrometer (WDS) measures the wavelengths of X-rays by making use of this characteristic.

What is a Wavelength Dispersive X-ray Spectrometer?
A wavelength dispersive X-ray spectrometer is constructed so that the specimen surface, analyzing crystal, and x-ray detector are positioned on a circle called the Rowland Circle, in order to satisfy Bragg’s law. Since a single analyzing crystal cannot be used to analyze all elements, normally, there are several diffraction elements incorporated into one instrument.
Microprobe analyzer specification (JEOL JXA-8230)
|
Detectable element range |
WDS:(Be)*1 /B~U, EDS:B~U |
|
Detectable X-ray range |
Detectable wavelength range with WDS : 0.087 to 9.3nm |
|
Number of spectrometers |
WDS: Up to 5 selectable, EDS: 1 |
|
Maximum specimen size |
100mm × 100mm × 50mm(H) |
|
Accelerating voltage |
0.2 to 30kV(0.1kV steps) |
|
Probe current range |
10-12 to 10-5 A |
|
Probe current stability |
±0.05%/h, ±0.3%/12h(W) |
|
Secondary electron image resolution |
6nm(W), 5nm(LaB6)*2 |
|
Scanning magnification |
×40 to ×300,000(W. D. 11mm) |
|
Scanning image resolution |
Maximum 5,120× 3,840 |
|
Color display |
For EPMA analysis : LCD 1,280 × 1,024 |
*1: With optional analyzing crystal for Be analysis
*2: LaB6 optional
OUR FACILITY
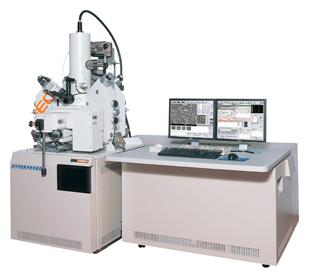
There are two sets of microprobe analyzer are in our possession: JEOL JXA 8100 and JEOL JXA 8230 with additional OXFORD EDS analyzers equipped.
Major tasks are to perform precise chemical analyses on minerals of natural and synthetic origins including common silicate, sulfide and intermetallic, simple oxide and synthetic metallic and nonmetallic materials.
The following elements are programmed in the Quantitative analysis for routine tasks:
(1)Oxides: K, Na, Mg, Ca, Si, Al, Fe, Ti, Cr, Mn, Ni, Zn
(2)Metals: Fe, Co, Ni, Cu, Zn, Mo, Cd, Sb, As, Bi, Au, Ag
The standards applied in our routine performance are SPI 53 sets standard minerals (U.S.A) and national standard GB sets (China).
Requirements for the analyzed specimen are strictly polished thin sections with proper glues of cover-free or targets of epoxy made. The specimen must be covered by electron conductive materials (carbon usually, or gold in particular cases). It can be completed in our facility by carbon surface preparator of JEOL
The Geochemical Analysis Of Trace Elements In Our Laboratory
The laboratory is a clean laboratory for the construction of trace and trace elements in geological samples. Laboratory built and opened to the domestic and international.
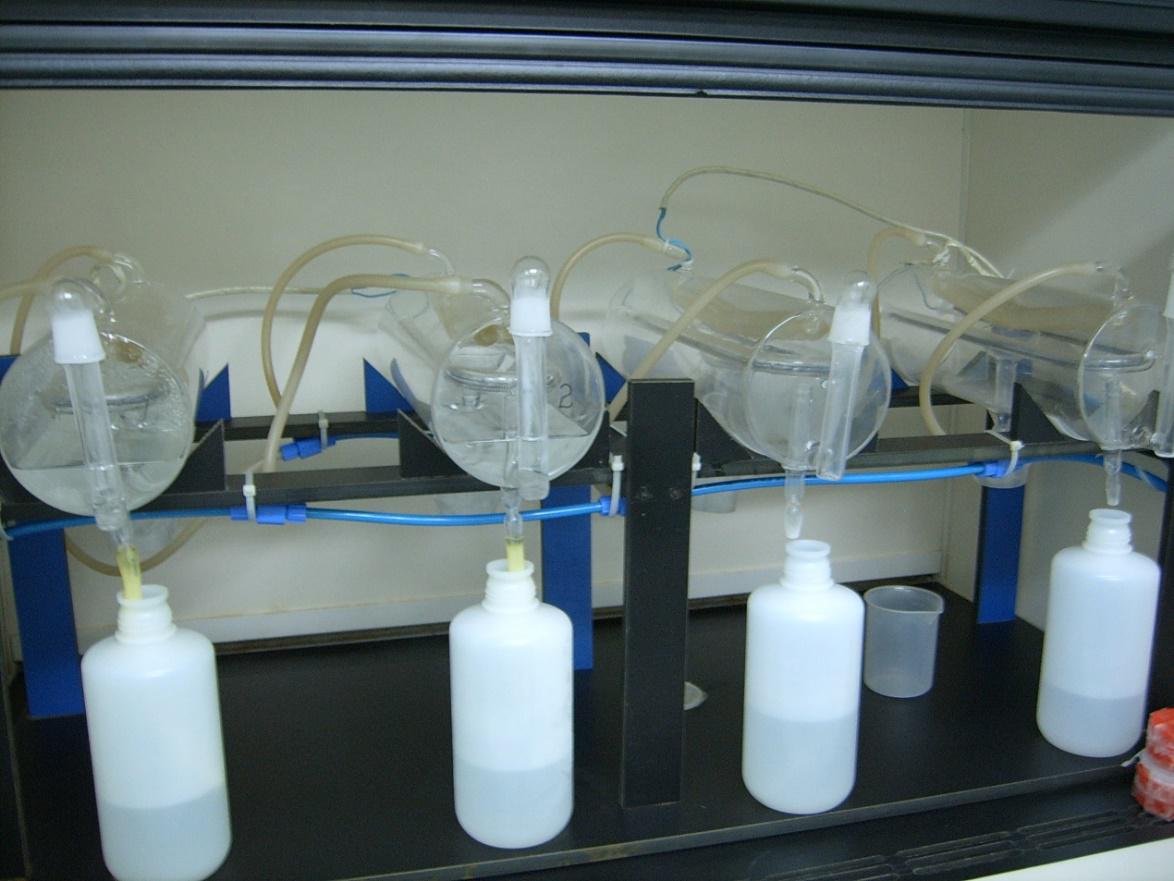
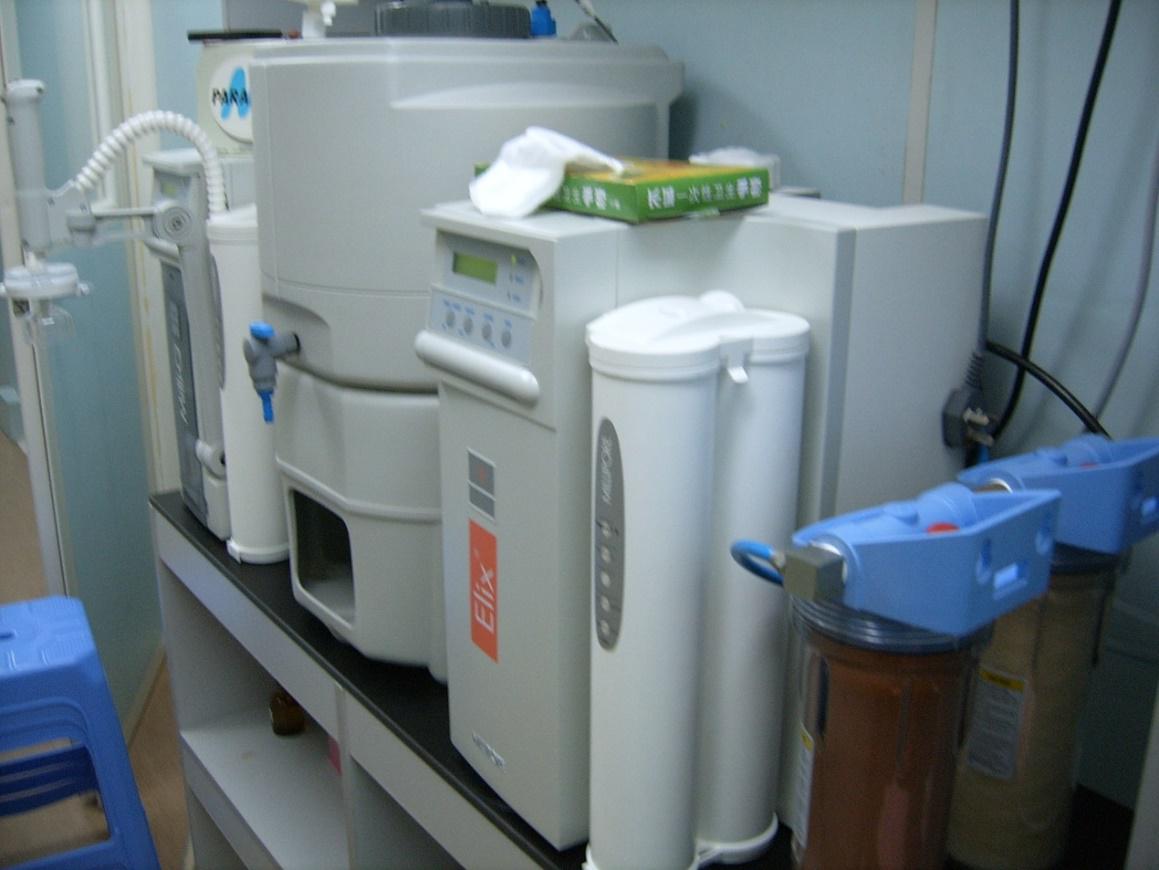
The laboratory is equipped with high performance ventilation system, high precision electronic balance, sealed solution sample, high pressure sealed solution sample, microwave digestion solution, intelligent ultra pure water equipment, and other equipment which is necessary for chemical pretreatment, and other related devices.
Laboratory for 3 people at the same time, the laboratory of clean degree to achieve high accuracy of trace element analysis of international standards.
Over the years in the school and outside researchers, scholars, to carry out trace element geochemical analysis of the required rock and ore samples before treatment, the obtained data are mainly published in the domestic and foreign high quality SCI journal.
Laboratory in recent years, many times to participate in the determination of the value of the international standards, and achieved satisfactory quality data.
For example, in 2010 to participate in blind test, the accuracy of the data obtained in the world's 30 laboratories ranked third. 2012 second.
Warmly welcome domestic and foreign scientific research personnel to carry out trace element geochemical analysis.
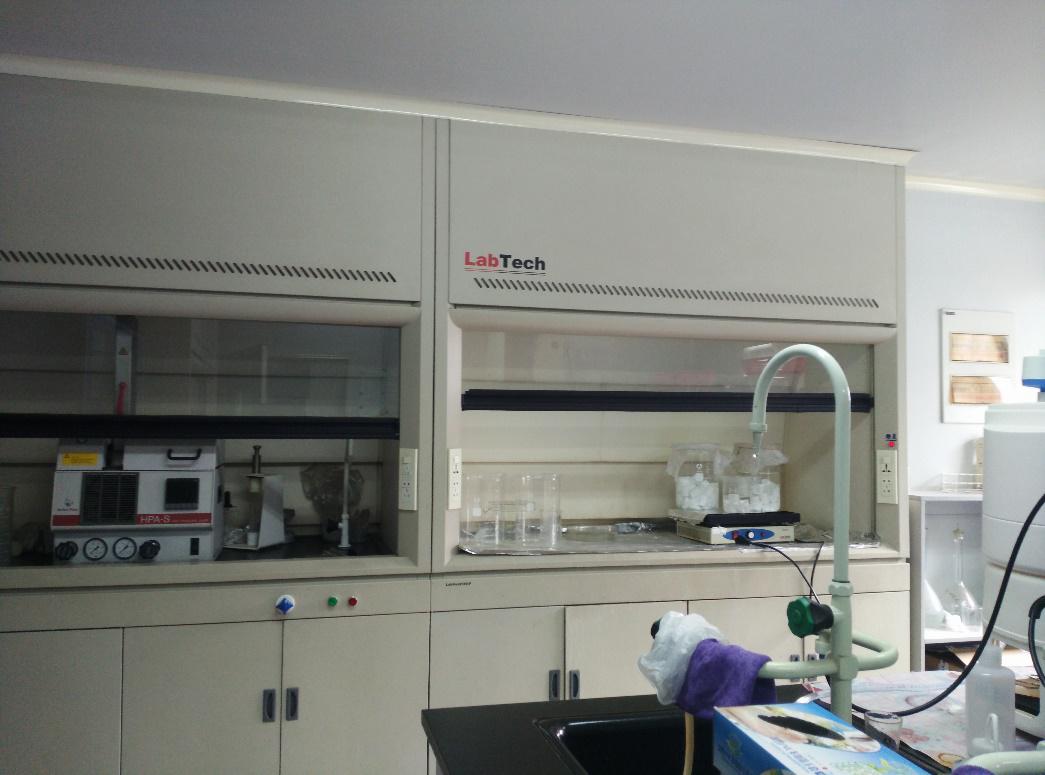
Pre treatment chemistry laboratory
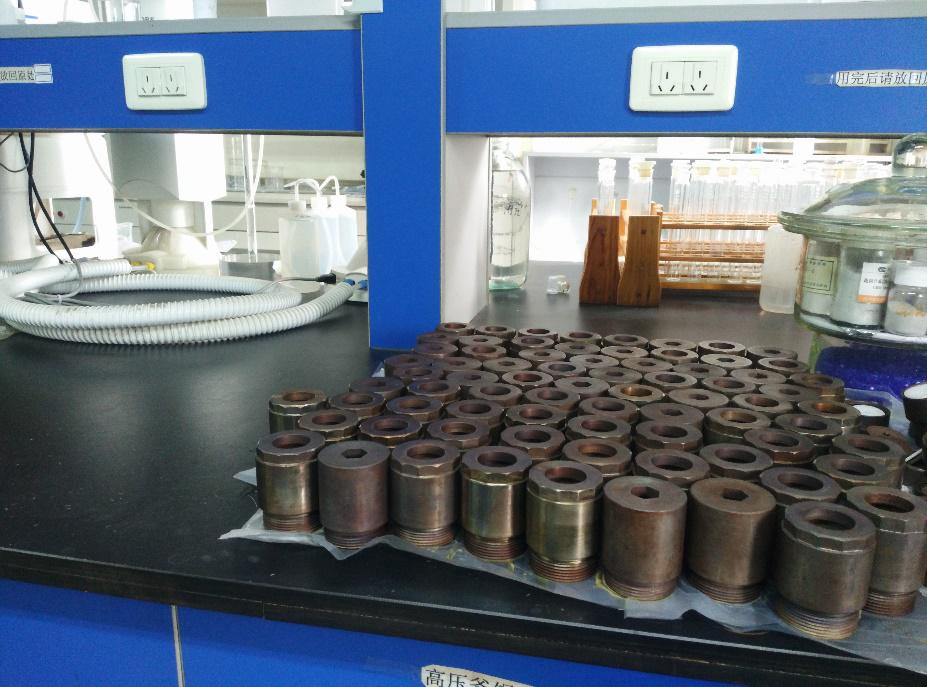
Geological samples
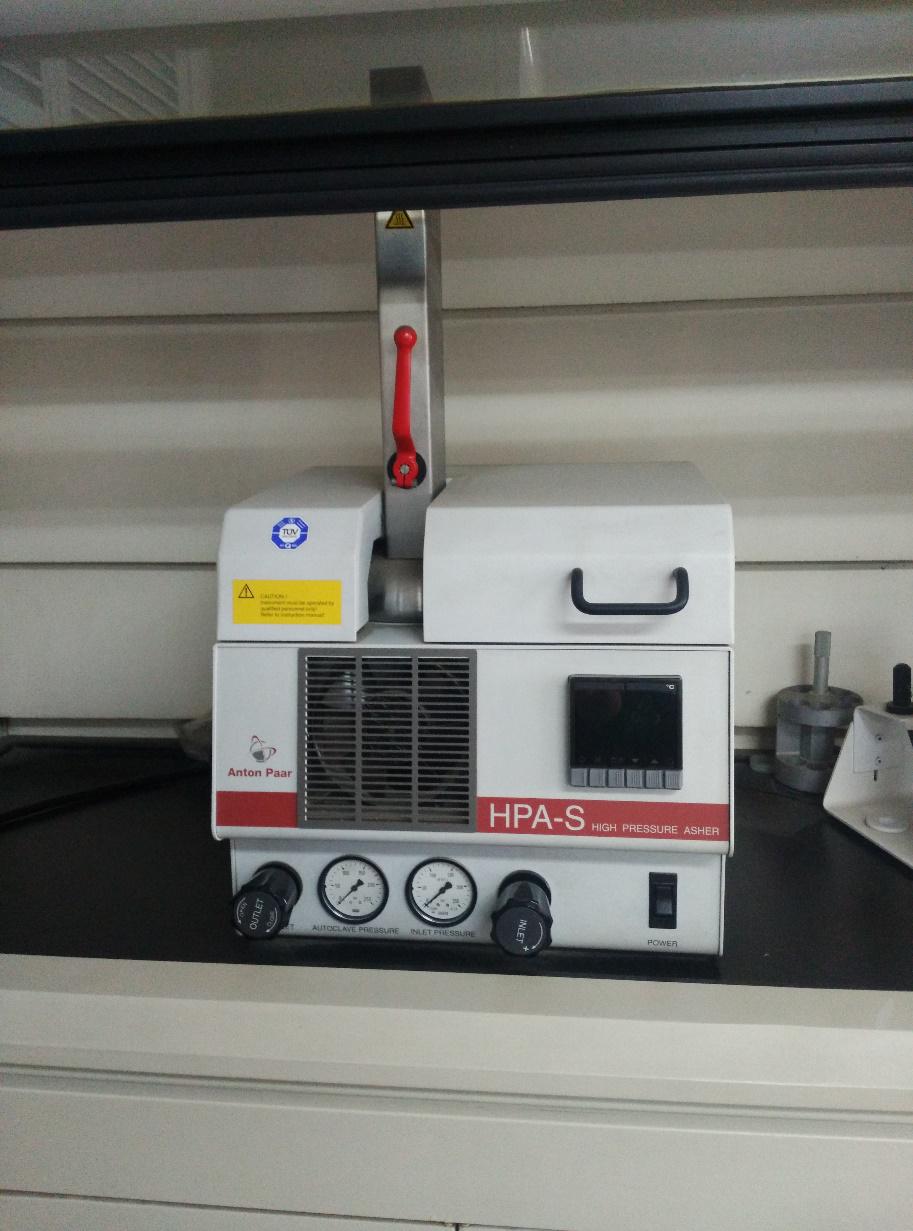
Sealed solution tank, high pressure sealing solution
The Ultra Clean Isotope Geochemistry Laboratory
The ultra clean isotope geochemistry laboratory is a part of the Key Laboratory of orogenic belt and crustal evolution of Peking University, which was built in 2001. The laboratory is divided into different functional areas by 4 small laboratories. From south to north is Rb-Sr, Sm-Nd separation laboratories, Pb isotope laboratories, acid purification laboratory and the pre-processing laboratory respectively. The cleanliness of each laboratory is of a thousand level, and the cleanliness of draught cupboard is of a hundred level. The experiment background of the whole processing of Rb-Sr、 Sm-Nd and Pb is controlled in the following 0.2ng, fully meet the needs of isotope separation.
The ultra clean laboratory is equipped with advanced equipment, operating specifications, records strictly. It is not only a pre - processing of radioactive isotopes and development of advanced methods, but also a laboratory for students. Here, undergraduates, graduate students can get more comprehensive understanding of the relevant knowledge of isotope geochemistry through participating.
This XRD laboratory was established in 2005 and installed with an X’Pert Pro MPD diffractometer, which is of a series of characteristics of 3kW power, in Cu radiation, at 0.0001° repeatability, a vertical goniometer in 240mm radius, 0-159°2θ scanning range and in 0.5-4Mcps intensity detectable level. Powder diffractometry can offer a series of analyses including phase identification, quantitatively analysis, unit cell refinement and the Rietveld structural refinement. The mono-capillary optics let micro-diffraction on a scale of 200 μm illumination become reality; Textural statistics can be performed by an Open Eularian Crade stage including pole-figure and ODF measurements; Up to 1200°C non-ambient in-situ diffraction can be carried out in both air and vacuum conditions; Grazing incident diffraction can be performed for film thick and phase measurements with a hydrid monochromator and parallel Soller diffraction beam optics.
So far as 8 Universities including Tsinghua University, 8 institutes including Chinese Academy of Science and 8 colleges within Peking University have been finished many important experiments in this XRD laboratory.
The fission track laboratory is primarily focused on fission track dating of apatite. We do traditional apatite fission track studies to understand orogenic development and low-temperaturethermal evolution of basins.
Principles of fission-track thermochronology
The decay of 238U by spontaneous nuclear fission, the same highly energetic decay process that is exploited in nuclear reactors and bombs, creates lines of radiation damage through the crystal lattice of the uranium-bearing material. Fission tracks are such damage features, and fission track analysis is the study and characterization of these features in minerals. The number of fission tracks in a uranium-bearing mineral is proportional to the time over which tracks have been accumulating and the uranium concentration of the mineral. Fission track dating relies on the same general equation as any radioactive decay scheme to date the time of rock cooling below closure temperature. Fission track analysis is unlike most methods of radiometric dating in that it measures the effect, rather than the product, of a radioactive decay scheme. Fission tracks are sensitive to heat, and therefore the technique is useful at unraveling the thermal evolution of rocks and minerals.
Autoscan Professional Fission Track Dating system
For supply of one Autoscan Professional Fission Track Dating system, complete with microscope, suitable for Earth Sciences( FTD) applications and general point counting procedures Comprising the following components:
General Items Description
AS3000i/f High-precision 3-axis motorised microscope stage;
scans 84mm(X) x 84mm(Y) x 3mm(Z): 2 micron repeatability
EL300 Electronic controller with power supply & all necessary connecting cables
JS300 Three-axis joystick controller / keypad
SW500 Trakscan application software with User Manual on CD
SW600 Trakscan Easy Length software module for fast accurate counting
ASDK Autoscan Software Development Kit
PC100 Current version IBM-compatible PC
Monitor CRT NEC”19” FD2141SB
Camera Sony SX710 high resolution monochrome camera with 3 year warranty
Microscope Zeiss Axio Imager microscope, with trinocular head and camera C-mount
Geological applications
Unlike many other dating techniques, fission-track dating is uniquely suited for determining low-temperature thermal events using common accessory minerals (such as apatite, sphene, zircon, micas and volcanic glass) over a very wide geological range. Fission track analysis provides detailed information on the low-temperature thermal histories of rocks, below ~120°C for tracks in apatite. Fission track analysis has been applied to a variety of geological problems: a) the structural evolution of orogenic belts; b) the thermal evolution of sedimentary basins; c) the source or provenance of sediments; d) the age of poorly dated strata; and e) long-term continental denudation.
Key FT publications
1.Tang W H, Zhang Z C, Li J F, Li K, Luo Z W, Chen Y. Mesozoic and Cenozoic uplift and exhumation of the Bogda Mountain, NW China: Evidence from apatite fission track analysis. Geoscience Frontiers, 2015, 6(4): 617–625, 10.1016/j.gsf.2014.04.006
2.Zheng Y, Zhang J J, Wang J M, Wang X X, Wang M. Rapid denudation of the Himalayan orogen in the Nyalam area, southern Tibet, since the Pliocene and implications for tectonics-climate coupling. Chinese Science Bulletin, 2014, 59(9): 874-885
3.Zhang Z C, Guo Z J, Li J F, Tang W H. Mesozoic and Cenozoic uplift-denudation along the Altyn Tagh Fault, northwestern China: Constraint from apatite fission track data. Quaternary Science, 2012, 32(3): 499–509 (in Chinese with English Abstract)
4.Yu X J, Ji J Q, Gong J F, Sun D X, Qing J C, Wang L N, Zhong D L, Zhang Z C. Evidences of rapid erosion driven by climate in the Yarlung Zangbo (Tsangpo) Great Canyon, the eastern Himalayan syntaxis. Chinese Science Bulletin, 2011, 56(11): 1123–1130, DOI: 10.1007/s11434-011-4419-x
5.Li J F, Tang W H, Liu Z, Zhang Z C. Apatite fission track analysis of Upper Jurassic Houcheng Formation at Qianjiadian area, Beijing and its geological significance. Chinese Journal Geophysics, 2010, 53(12): 2907–2917, DOI: 10.3969/j.issn. 0001-5733. 2010.12.014 (in Chinese with English Abstract)
6.Wang L N, Ji J Q, Sun D X, Xu Q Q, Tu J Y, Zhang Z C, Hang, B F. The uplift history of south-western Tianshan—Implications from AFT analysis of detrital samples. Chinese Journal Geophysics, 2010, 53(4): 931–945(in Chinese with English Abstract)
7.Zhang Z C, Gong J Y, Wang X F, et al. Ar-40-Ar-39 and fission-track analysis of eastern segment of Altyn Tagh fault and its geological significance. Acta Petrologica Sinica, 2008, 24(3): 1041–1053 (in Chinese with English Abstract)
8.Qing J C, Ji J Q, Wang J Q, Peng Q L, Niu X L, Ge Z H. Apatite fission track study of Cenozoic uplifting and exhumation of Wutai Mountain, China. Chinese Journal Geophysics, 2008 , 51(2): 384–392 (in Chinese with English Abstract)
9.Zhang Z C, Guo Z J, Wu C D, Fang S H. Thermal history of the Jurassic Strata in the Northern Tianshan and its geological significance, revealed by apatite fission-track and vitrinite-reflectance analysis. Acta Petrologica Sinica, 2007, 23(7): 1683–1695 (in Chinese with English Abstract)
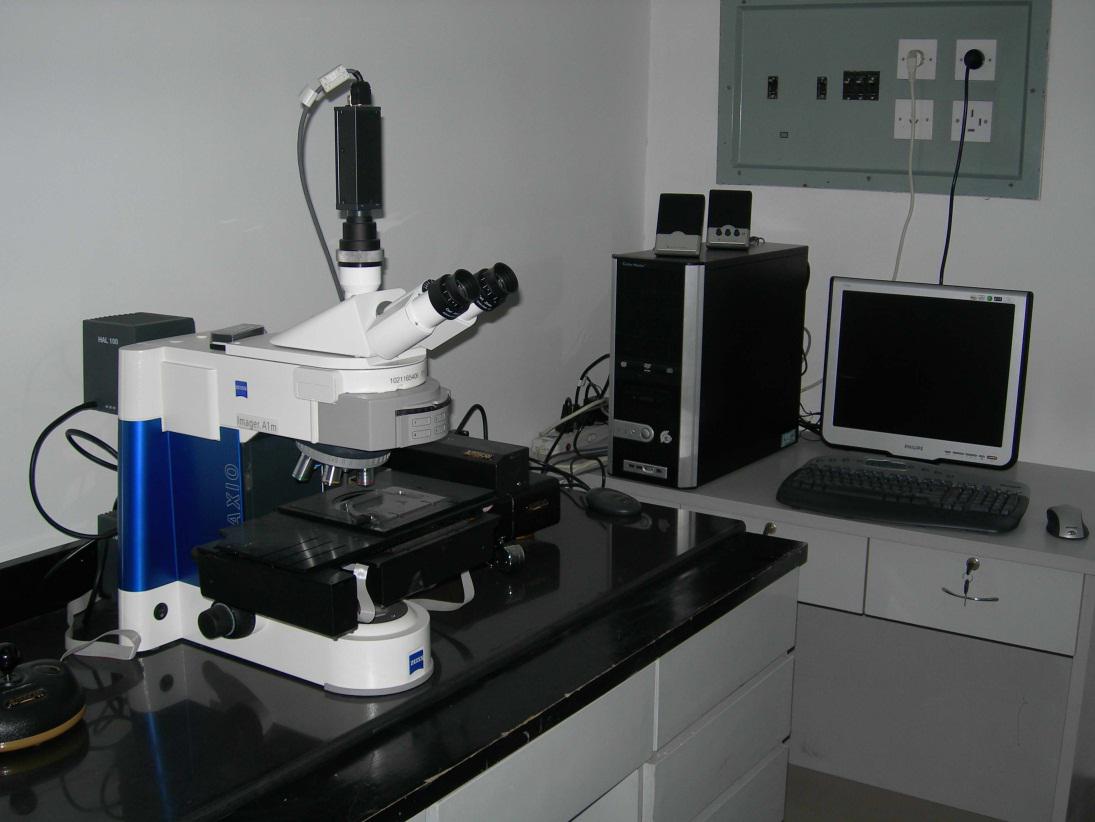
Autoscan Professional Fission Track Dating system
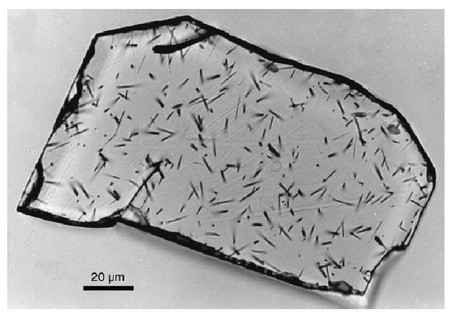
Etched fission tracks in an apatite grain from the Grassy Granodiorite of King Island, southeastern Australia. The tracks show their characteristic appearance as randomly oriented, straight-line etch channels up to a maximum length of around 16μm. The tracks appear as dark, high-contrast features in this image observed under a high magnification dry objective. Faint continuous lines across the surface are polishing scratches.(after Gleadow et al. , 2000)
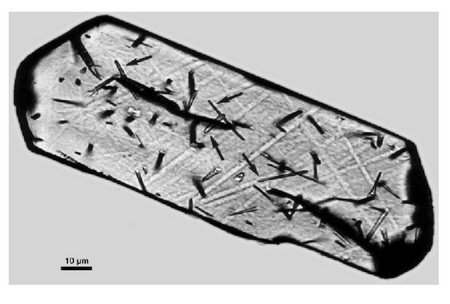
Etched spontaneous fission tracks on a polished internal surface cut in an apatite crystal, observed at high magnification using a dry microscope objective. Most of the visible tracks are surface intersecting spontaneous tracks which are used for age determination. Arrows point to four individual confined tracks which do not intersect the surface but are fully contained within the body of the apatite crystal and etched from fractures which allow passage of etchant from the surface to the tracks.(after Gleadow et al. ,1986)
Scanning Electron Microscopy of SESS. PKU
Welcome to Peking University Electron Microscopy Laboratory
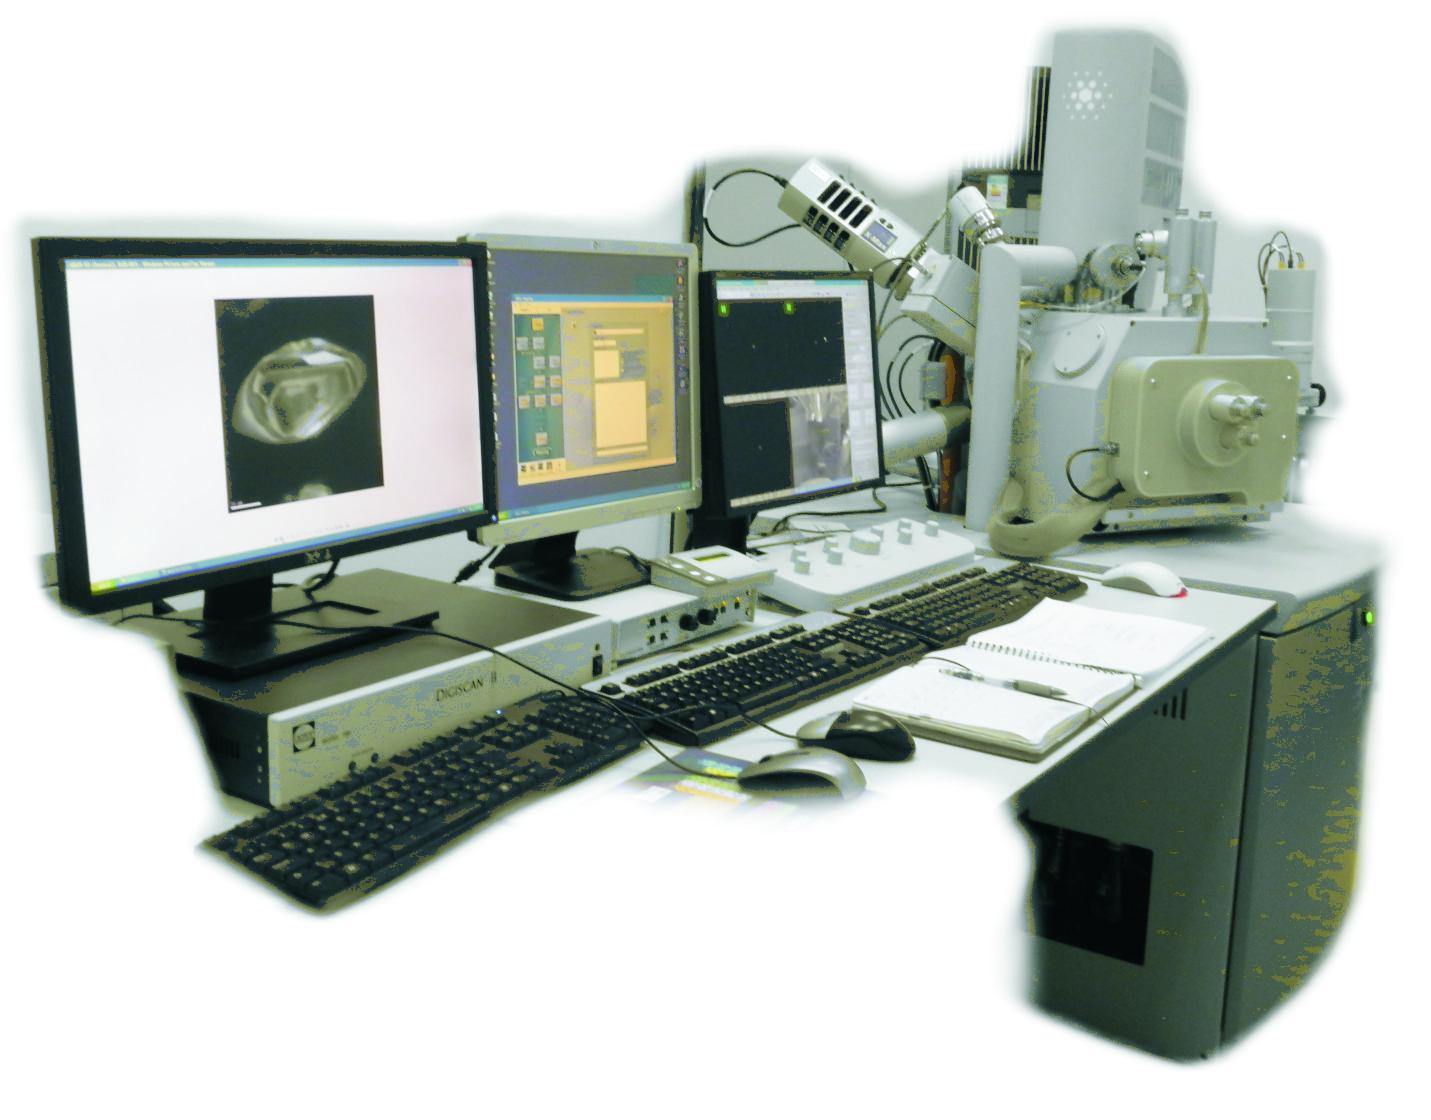
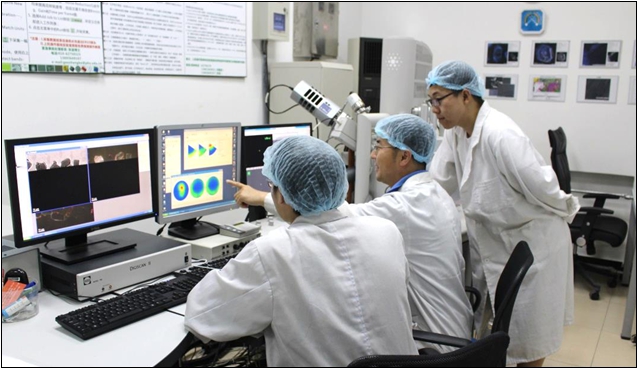
Located in the Key Laboratory of Orogenic Belts and Crustal Evolution in School of Earth and Space Sciences (SESS), Peking University (PKU), Beijing, our SEM Lab has state-of-art high resolution scanning electron microscopes (SEM). Our goal is to provide best microscopy and analytical services to our faculty and academic collaborators. We frequently utilize Energy Dispersive X-ray Spectroscopy (EDS), Electron Backscatter Diffraction (EBSD), Cathode Luminescence (CL), sample manipulation and surface modification capabilities installed on our electron microscopes. The multi-user facility attracts clients from aerospace, geology, automotive, pharmaceutical, textile, electronics, environmental and medical industries. The affordable cost, wide range of capabilities and minimum wait time make the facility very attractive to area researchers.
Our staff members with many years of microscopy and analytical services experience provide the best and most professional services which helped us to establish ourselves as one of the premier multi-user microscopy facilities. We are proud of our dedicated service, strong scientific credibility and long lasting user relationships with industry and academia. We cordially invite you to visit us and become our collaborators. We are confident that our services will satisfy your research, business and product development needs.
SEM: FEI Quanta 650 FEG
The FEI Quanta 650 FEG is a variable pressure scanning electron microscope (SEM). It produces a magnified image of a sample by scanning a focused electron beam across the surface of a sample and observing various signals produced when the electrons interact with the sample. By reducing the size of the scan, the magnification is increased. Almost any solid material can be observed using the SEM. Because of the variable pressure abilities of the SEM it is possible to observe insulating materials directly without the need for a conductive coating. It is also possible to observe biological materials without the need for extensive sample preparation.
This field emission scanning electron microscope (SEM) has an ultra-stable, high current Schottky gun. Advanced electron optical and detection features include immersion mode, beam deceleration mode, and a variety of secondary and backscatter electron detectors (see below) for best selection of the information and image optimization.
Variable pressure operation of the SEM allows for a lower vacuum to exist at the sample than is traditionally required. By "leaking" air into the sample chamber it is possible to directly observe samples that have been frozen or are otherwise wet, oily or non-conductive. Traditionally, extensive sample preparation methods have been required to make hydrated samples ready for SEM observation. With the advent of variable pressure operation, sample preparation is simplified to simply freezing the sample and placing it in the microscope. Variable pressure operation also provides a positively ionized gas immediately above the sample. This source of positive ions works to dissipate the negative charge that accumulates on the sample surface during SEM observation and can interfere with image collection. This means that non-conductive samples can be imaged without application of a conductive coating. The FEI Quanta 650 FEG is equipped with two imaging detectors useable in a variable-pressure environment. The backscattered electron detector (BSE)images backscattered electrons that originate deeper within the sample, where contrast is dependent on the average atomic number of the sample. The secondary electron (SE) detector images secondary electrons produced very near the sample surface and contrast is dependent on surface topography.
EDS: Oxford Inca with Silicon Drift Detector (SDD)
The Oxford Instruments Silicon Drift Detector (SDD) - X-MaxN -50mm2 energy dispersive spectrometer system (EDS) is attached to the SEM and allows for the examination of the chemical composition of materials. The system is equipped with a silicon-drift energy dispersive x-ray detector and is capable of extremely high rates of data acquisition. It can be used for point analysis (qualitative or quantitative) of very small areas of interest (down to 1 micrometer in diameter). It can also be used to assemble element distribution maps and line scans to show the spatial distribution of elements within a sample.
CL: Gatan ChromaCL
The Gatan ChromaCL cathodoluminescence system is attached to the SEM and allows for the observation of visible light emitted from a sample when it is subjected to the electron beam of the SEM. This phenomenon is very sensitive to minor changes in chemistry of semiconducting materials such as minerals. By examining the visible light emitted from a sample it is possible to detect minute changes in chemical composition over very small distances in a sample, thereby revealing otherwise invisible internal structure.
EBSD: HKL NordlysF
The system is able to collect and analyze electron diffraction data from an array of points on the sample and assemble that data into a map showing the relative orientation of adjacent crystals within a sample.
The CHANNEL5 suite of programs has been developed to allow you, the user, to manipulate, analyse and display Electron Backscatter Diffraction (EBSD) data with comparative ease. Forescatter detector (FSD) system, with up to 6 independently controlled detectors around the phosphor screen. Forescatter detector control is through the CHANNEL 5 suite of programs, CHANNEL 5 includes an automated optimisation routine for orientation or atomic number contrast imaging. This solution incorporates the flexibility and versatility for customised image acquisition.
Other Accessory Equipment:
Sample preparation instruments: VibroMet™ 2 Vibratory Polisher and Sputter Coaters and SEM/TEM Carbon Coaters (Q150T ES)
The VibroMet® 2 Vibratory Polisher removes minor deformation remaining after mechanical preparation revealing a stress-free surface without need for the hazardous electrolytes required by electro-polishers. Combine the VibroMet 2 with MasterMet 2 collidal silica to chemomechanically polish a specimen to a surface finish suitable for electron-backscatter diffraction (EBSD) or atomic force microscopy (AFM). Unlike traditional vibratory polishers, the VibroMet 2 oscillates almost entirely horizontally, maximizing the length of time the specimen touches the polishing cloth. Specimens naturally rotate around the polishing bowl allowing users to set-up the system and walk away.
The Q150T is a compact turbomolecular-pumped coating system suitable for SEM, TEM and many thin film applications. Q150T ES has a high resolution sputter and high vacuum carbon coater.
These instruments are located in the Key Laboratory of Orogenic Belts and Crustal Evolution and are available to members of the Peking University, but we encourage enquiries from outside the University, including academic, commercial and industrial users.
Potential users should contact the Facility Manager: Dr. Bo Zhang.

